Have you ever tried comparing products, service plans, or project options, only to find yourself lost in messy spreadsheets and scattered notes? This is a common challenge for anyone who needs to make informed decisions based on multiple choices.No matter if you're assessing features, detailing the advantages and disadvantages, or coordinating with stakeholders, clarity matters. Fortunately, comparison charts are there to make it happen. They turn scattered information into structured visuals, helping you see your options clearly and choose with confidence.
In this article, we’ve selected 10 of the most effective free comparison chart makers available today. From simple online tools to intelligent, AI-powered platforms like Fluig, these solutions can help you work faster, think more clearly, and communicate with impact.
Table of Contents
- What is a Comparison Chart?
- How to Use a Comparison Chart Maker?
- 10 Free Comparison Chart Makers You Should Try
What is a Comparison Chart?
A comparison chart is a visual tool that allows you to evaluate multiple items side by side, organizing key features or characteristics in a structured format. According to Wikipedia, a comparison chart "is a graphic representation of data that organizes items in a manner that allows for easy comparison of their features or characteristics." Essentially, it transforms complex, scattered information into a side-by-side, easy-to-digest comparison.
While regular charts may present data in a single dimension, such as showing trends over time or summarizing statistics, a comparison chart focuses on directly contrasting multiple items across various categories. This makes it especially effective for decision-making processes, as it allows you to immediately see how different options measure up against each other. Whether you’re evaluating product features, comparing service plans, or reviewing academic programs, comparison charts give you clarity and structure.
The key advantage of a comparison chart is its ability to reduce cognitive load. It organizes data in a way that makes it easier for the reader to process and make decisions, saving time and effort compared to reading through lengthy reports or analyzing scattered notes.
Comparison charts are versatile tools, used by people across various industries and roles.
- Product managers use them to evaluate competing products, compare features, and plan product roadmaps. By visualizing comparisons, they can quickly spot key differences and prioritize features accordingly.
- Educators and students use them to compare academic theories, different authors, or courses. A comparison chart simplifies the process of comparing curricula, highlighting strengths and gaps in knowledge.
- Marketing teams rely on comparison charts to present various service tiers, pricing options, or product features in a way that’s visually appealing and easily understood by customers.
- Content creators and bloggers often use comparison charts to summarize tools, services, or workflows, helping their audiences make informed decisions without the clutter of overwhelming information.

Comparison charts are invaluable for anyone who needs to make decisions based on multiple, varied options. In addition to the people listed, the comparison chart can also be used by more people.Whether you're new to chart-making or looking to streamline your process, the right tools can make all the difference. In the next section, we’ll walk through how to effectively use comparison chart makers to turn your data into clear, visual insights.
How to Use a Comparison Chart Maker?
Over the years, the way we create comparison charts has evolved. In the past, making a chart was a manual, time-consuming task that required carefully inputting data into templates. Today, thanks to advancements in technology, we can either rely on traditional methods or take advantage of AI-powered tools that simplify the process. While traditional methods still have their place, AI-driven tools significantly enhance the speed and ease of creating comparison charts, allowing for more efficient decision-making and a smoother workflow.
Traditional Comparison Chart Makers
The traditional method of creating comparison charts typically involves:
- Choosing a template: Most traditional chart tools offer basic templates for comparison, such as tables or grids, where you input your data.
- Manually entering data: You would then input the data for each item manually into the rows and columns of your template.
- Customizing the design: After entering the data, you can adjust the layout, fonts, and colors to make the chart visually appealing and easy to read.
- Exporting and sharing: Once your chart is complete, you can export it as an image, PDF, or share it with others.
- While effective for basic comparisons, this method can become tedious and time-consuming, especially when comparing multiple options or working with complex data.
AI-Powered Comparison Chart Makers
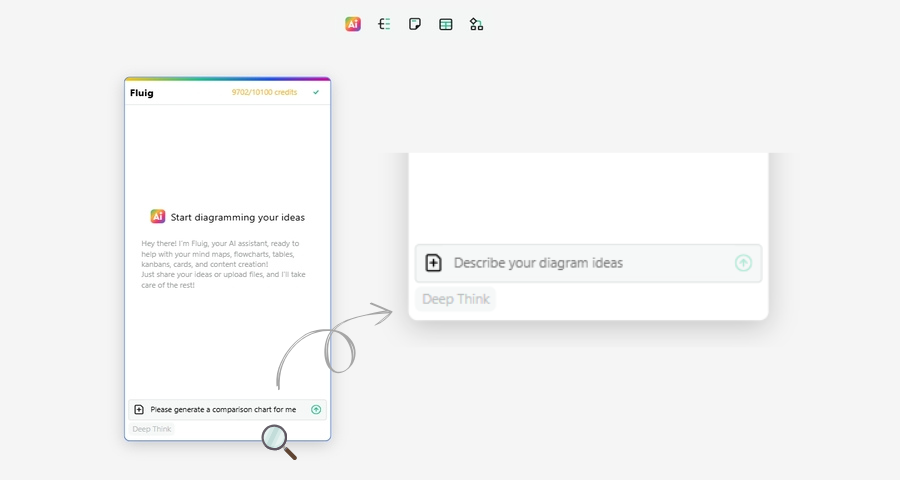
AI-powered comparison chart makers, like Fluig, simplify the process by automating many of the steps involved. Here’s how it works in just three simple steps:
- Input Your Content: Instead of manually entering data into rows and columns, you simply describe what you want to compare in natural language. It can be a word or an idea.
- Edit Your Chart: Once the chart is generated, you can edit the content to fine-tune details. You might want to add extra data, modify descriptions, or even change the visual style. AI tools allow for quick and easy customizations, helping you highlight key features, adjust colors, and add icons to enhance the chart’s clarity.
- Export and Share: After editing, you can export the final chart as an image, PDF, or directly share it with others through a link. Many AI-powered tools also allow real-time collaboration, making it easier to get feedback or work on the chart with others in your team or organization.
With these tools and methods in mind, it's evident that creating comparison charts has become increasingly convenient. Now, let’s take a closer look at 10 of the best comparison chart makers available today. Each designed to help you make better decisions, faster.
10 Free Comparison Chart Makers You Should Try
There are many tools available today that make creating comparison charts easy and efficient. Whether you’re looking for a simple table or a more interactive, AI-powered option, here are 10 free comparison chart makers that can help you visualize your choices and make smarter decisions.
Fluig leverages the power of AI to make creating comparison charts effortless. By simply describing what you want to compare, whether it's products, services, or features, the AI generates a structured, professional chart for you. It’s an ideal tool for product managers, marketers, and anyone who needs to create comparison charts quickly without design expertise. The platform also allows for easy customization, letting you adjust the design and share charts with your team in real time. Fluig supports diverse kinds of comparison charts, such as bar chart, pie chart, line chart, radar chart and so on.

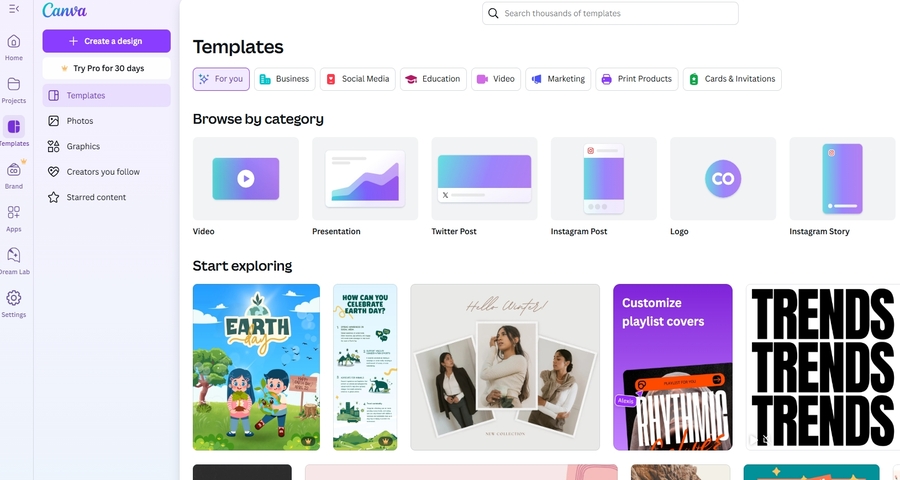
Known for its drag-and-drop design features, Canva offers templates for creating comparison charts with ease. It’s particularly useful for designers and creative professionals who want to produce visually appealing charts without spending too much time. With Canva, you can customize everything from fonts to colors, making it perfect for those who value design aesthetics while still needing clarity in presenting comparison data.
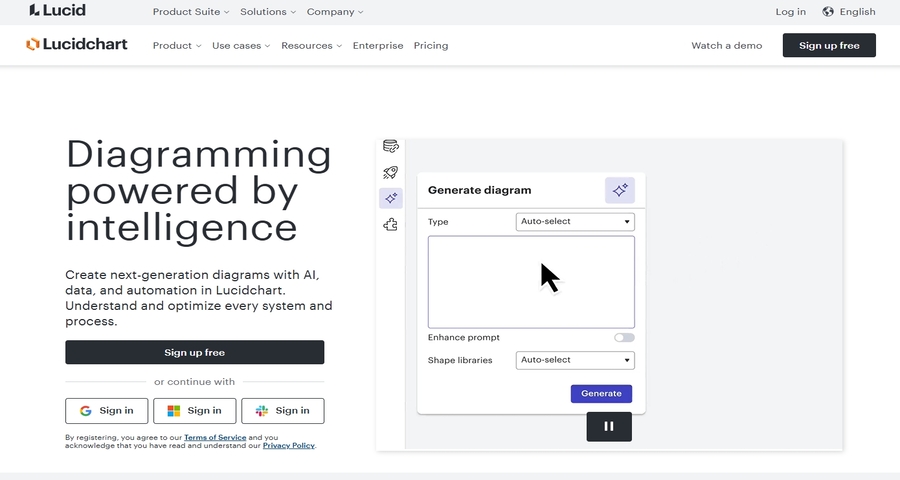
Lucidchart is a diagramming tool that helps you create detailed comparison charts, especially for team-based decision-making. The platform allows you to create side-by-side comparisons with ease and facilitates real-time collaboration, making it perfect for businesses that need input from multiple stakeholders. Lucidchart is best suited for teams and organizations looking for a more detailed and customizable comparison chart.
Visme is another robust tool that combines design flexibility with the ability to create interactive comparison charts. It offers a range of templates that can be customized for various use cases. Whether you're an educator, marketer, or content creator, Visme provides a user-friendly platform to build visually engaging and informative charts, complete with animation and interactive features.

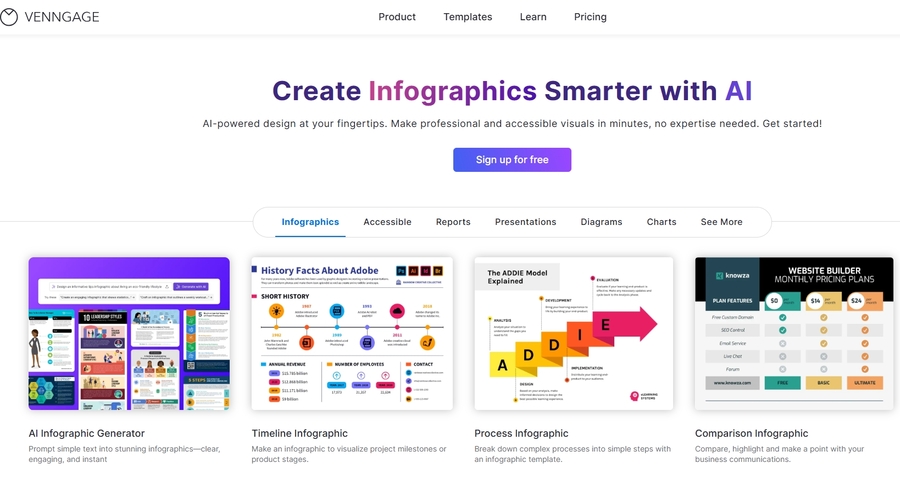
Venngage, a tool focused on infographics, offers several templates for comparison charts. It’s perfect for content creators and marketers who need to communicate complex data in a simple, visual format. The platform’s drag-and-drop editor makes it easy to create and customize your comparison chart, while its modern design options help make your information stand out.
ChartBlocks offers a straightforward platform for creating comparison charts. Its intuitive interface allows you to input your data, select a chart type, and customize it with a variety of design elements. This tool is ideal for those who need a simple and effective solution for turning raw data into clear, easily digestible charts.
Google Sheets may not offer pre-built comparison chart templates, but it’s a powerful tool for creating comparison charts from raw data. By using its built-in charting tools, you can quickly generate line charts, bar graphs, or even tables to compare options.
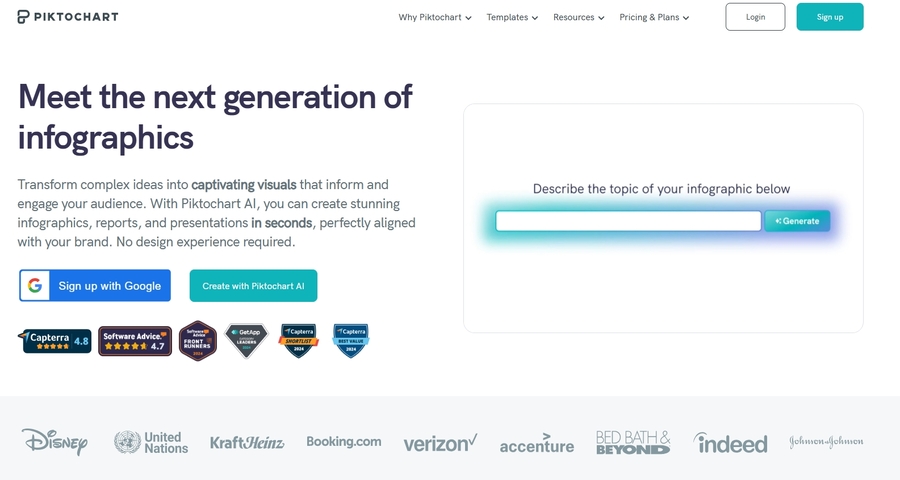
Piktochart is a versatile tool that allows you to create various types of charts, including comparison charts. With its easy-to-use editor and vast template library, it’s perfect for users who want to create visually appealing charts for presentations, marketing materials, and reports.
Infogram is a tool that specializes in creating interactive charts and infographics. It allows you to create comparison charts that are not only visually appealing but also interactive, helping you engage your audience more effectively.
Primarily used for scientific and academic purposes, Mind the Graph offers professional-grade comparison chart templates. It’s especially useful for researchers, scientists, and educators who need to compare technical data or academic theories.

These 10 comparison chart makers provide a variety of options to suit different needs and preferences. Whether you're looking for simple, visual comparisons or more interactive and AI-powered tools, these platforms offer efficient and effective ways to present your data.
Conclusion
Creating comparison charts has never been easier, thanks to the wide range of tools available today. Whether you're comparing products, services, or features, these tools help you visually organize data, make better decisions, and communicate your findings with clarity. From traditional chart builders to AI-powered platforms like Fluig, there’s a tool for every need. By choosing the right tool, you can save time, improve decision-making, and create charts that truly resonate with your audience.
So, try out these 10 free comparison chart makers and see how they can streamline your workflow and enhance your decision-making process. With the right chart at your disposal, you’ll always be equipped to make smarter, more informed choices.
FAQ
1.What is a Comparison Chart?
A comparison chart maker is a tool that helps you visually compare multiple options, products, services, or features side by side. It organizes key information into a chart format, making it easier to identify similarities, differences, and key points at a glance.
2.Why should I use a comparison chart maker?
Comparison charts simplify decision-making by presenting information in a clear and organized way. They save time, reduce cognitive load, and help you quickly analyze options, making them perfect for product comparisons, feature analysis, and decision-making in business or personal projects.
3.What’s the difference between a comparison chart and a general chart?
A comparison chart is specifically designed to highlight the differences and similarities between multiple items or options. It usually presents data side-by-side, allowing viewers to easily compare features, prices, or performance metrics. In contrast, a general chart typically presents data on a single dimension without focusing on direct comparisons between multiple items.
4.What are the benefits of using an AI-powered comparison chart maker?
AI-powered comparison chart makers, like Fluig, offer several advantages, including:
①Faster chart creation: Simply describe what you need, and the AI will generate the chart for you.
②Customization: AI tools automatically structure data in the best format and allow you to easily tweak the design.
③Collaboration: Many AI tools allow for real-time collaboration, making it easier to work with teams.
5.How do I create a comparison chart using a comparison chart maker?
Creating a comparison chart typically involves three simple steps:
①Input your content: Describe what you’re comparing in natural language or input data manually.
②Edit and customize the chart: Once the chart is generated, you can customize it to fit your needs (e.g., adjusting design elements, adding extra details).
③Export and share: After finalizing your chart, you can export it as an image, PDF, or share it directly with others.
6.Can I create a comparison chart for free in Fluig?
Yes, you can create your comparison chart in Fluig for free. There are many features and diagrams for you to use. If you would like to get more AI credits or improve the exported picture quality, you can consider different packages there.
7.Which comparison chart maker is best for beginners?
For beginners, tools like Fluig, Canva, and Google Sheets are excellent options. They are user-friendly, offer templates to get you started quickly, and require no advanced design skills to create clean and effective comparison charts.
8.How do I choose the best comparison chart maker for my needs?
When selecting a comparison chart maker, consider the following:
①Ease of use: How intuitive is the tool? Beginners may prefer simple drag-and-drop tools.
②Customization options: How much flexibility do you need in terms of design and layout?
③Collaboration features: If you're working with a team, check if the tool supports collaboration.
④AI capabilities: If you're looking for efficiency, AI-powered tools like Fluig can save time by automating the chart creation process.
